


History
History
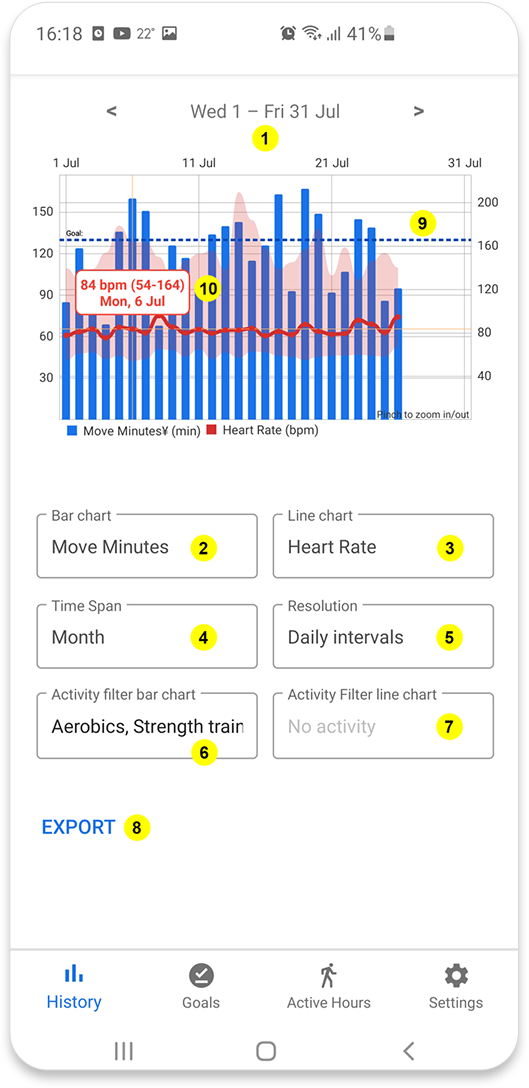
In the history tab you can analyse your Google Fit history in a multitude of ways.
-
- Date selection
- You can view your Google Fit data from any date in the past. If you click on the date you will get a popup window where you can select any date.
- You can use the left or right arrow to quickly go back or forward using the selected time span
-
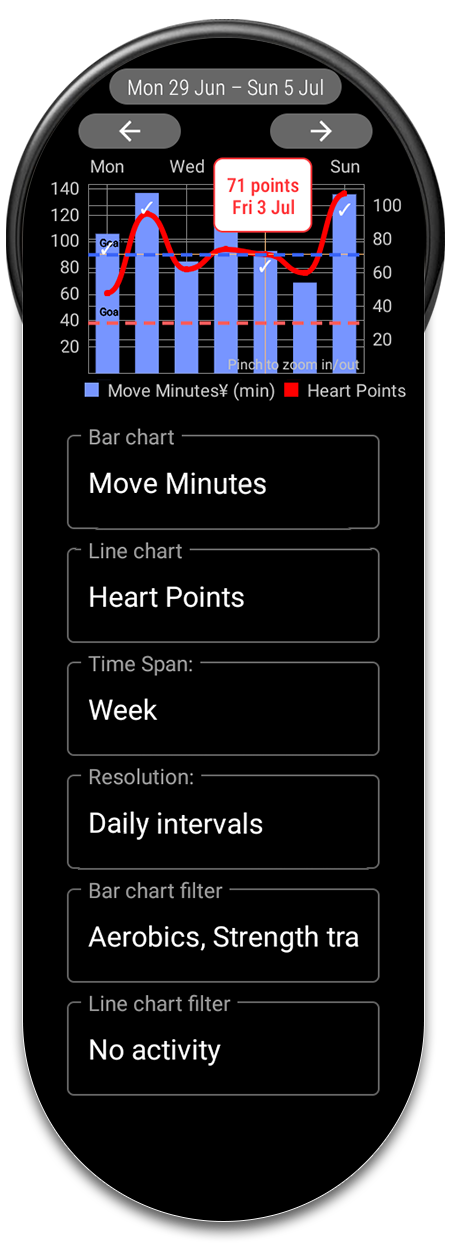
- Data source for bar chart
- Here you select data source for the bar chart displayed on the left axis in the chart
- These are the data sources you can select:
- Heart points
- Move minutes
- Steps
- Calories
- Distance
- Activities (choose what activity to view)
- Heart rate
- Weight
- Active hours
-
- Data source for line chart
- Here you select data source for the line chart displayed on the right axis in the chart
- You can choose the same sources as for the bar chart. If you select heart rate it will show the average as well as max and min for each data point
-
- Time span
- Here you select what time span you want to view the data.
- These are the time spans you can select:
- 1 day
- 1 week
- 1 month
- 3 months
- 6 months
- 1 year
-
- Resolution
- Here you select what resolution intervals to view the data in. Most data will be aggregated over the resolution interval (for example if you choose a resolution of a week and you select Steps it will show the total number of steps for each week)
- For heart rate the data will show the average during the interval instead (if you use the line chart it will also show the max and min heart rate
- These are the resolutions you can select:
- 1 min intervals
- 5 min intervals
- 30 min intervals
- hourly intervals
- daily intervals
- weekly intervals
- monthly intervals
-
- Activity filter bar chart
- Here you select one or a group of activities that you can filter the data showed in the bar chart. You could for example see a break-down of distance you have covered doing road biking and mountain biking. Or you could see how manu heart points you have collected doing Aerobics.
-
- Activity filter line chart
- The same kind of activity filter as for the bar chart but applied to the line chart instead
-
- Export data
- Here you can choose to export the data shown in the chart.
- The data will be exported in a comma separated ("csv") file that you can import in any spreadsheet tool such as Excel
-
- Goal line
- If you have defined a goal using any of the data sources displayed in the chart and the goal uses the same resolution period it will show as a dashed line in the chart
- Fit Companion will try to translate the goal to the chosen resolution. For example if you have a goal for 10 000 steps per day but you are showing a weekly resolution period it will translate the goal to 70 000 steps per week.
-
- Measurement point details
- Touch a particular measurement point and details about that mesurement point will pop up